Name: Grade:
GEOLOGY 101
LABORATORY – Lab #2 – Isostacy and Plate Tectonics
How Density and Gravity Control Plate Dynamics
Introduction: Why does the Earth have continental areas and oceanic areas? Rephrasing the question a bit, why does the Earth’s surface divide into two distinct regions of elevation: the continents (average elevation about 0.5 miles above sea level), and the ocean basins (average elevation about 2.3 miles below sea level)? The answer relates to the fact that Earth’s surface is made up of two different types of crust: the continental crust and the oceanic crust. These two types of crust differ in both their thickness and density. In this lab, you will see how these two properties control the elevation of the continents versus the ocean basins.
Relationship between Volume, Mass, & Density
Density is a measure of mass per unit volume. To use water as an example, a gallon (a unit of volume) weighs about 8.33 pounds (a unit of mass). Therefore, the density of water is 8.33 pounds per gallon. We can use any measurement of mass and/or volume to express density. Water’s density is also 62.4 pounds per cubic foot (62.4 lbs/ft3), 1.0 kilogram per liter (1.0 kg/L), or 1.0 gram per cubic centimeter (1.0 gm/cm3), which is the same thing as 1.0 gram per milliliter (1.0 gm/mL). You measured water’s density in the first lab. What did you calculate for water’s density?
In this lab exercise, we will use the standard Metric System unit for density, which is grams per cubic centimeter (gm/cm3). To measure the density of something in gm/cm3, we need to measure both its mass in grams and its volume in cubic centimeters. Measuring mass is easy; we just weigh the object on a scale. Measuring volume is more difficult. We will measure volume in two ways: by linear dimensions and by water displacement.
Question 1: Heft the pieces of hardwood and redwood
in your two hands. Which one feels
denser (heavier for a given amount)?
Determine the density of hardwood and redwood. Weigh the blocks to the nearest gram. Then use a ruler to measure, in centimeters, the length, width and height of the blocks. Make all measurements to the first decimal place (0.1).
Hardwood: Weight:
_____gm Length: _____cm Width: _____cm Height:
_____ cm
Volume: (length x width x height): ________ cm3
Density: (weight / volume): ______________ gm/cm3 (round to nearest
0.01)
Redwood: Weight:
_____gm Length: _____cm Width:
_____cm Height: _____ cm
Volume: (length x width x height): ________ cm3
Density: (weight
/ volume): ______________ gm/cm3 (round
to nearest 0.01)
Question 2: The density of water is 1.0 gm/cm3.
Comparing the density of water to the density of hardwood and redwood, predict
what proportion (percent) of your blocks will stick up out of the water when
the pieces of wood are floating.
Hardwood: _________ % of the block will be underwater, and ________ % will stick out of the water.
Redwood: _________ % of the block will be underwater, and ________ % will stick out of the water.
Question 3: Take the pieces of hardwood and redwood and float them in water. Do your predictions in #3 above fit with what you see?
Draw below a simple side-view sketch of the two blocks
across the waterline, labeling each block and showing how different proportions
stick above the water. Label the %’s of
each block on the sketch. (Note: Keep
this observation in mind when you do the final part of the lab.)
______________________________________________________________________ water line
Question 4: Think about what you saw with the blocks of wood floating. What effect did the difference in density between the two types of wood have on how high each one floated?
ISOSTATIC EQUILIBRIUM
OF THE EARTH’S CRUST
In this part of the lab, we will see how differences in the density and thickness of rock control the elevations of the Earth’s crust. We’ll also see how the crust adjusts when loads of weight are added or taken away.
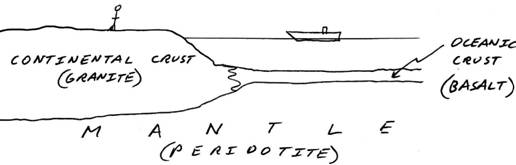
The Earth is made up of two kinds of crust: continental crust and oceanic crust. Continental crust, which is mostly granite and rocks of similar density, makes up the continents. Oceanic crust is mostly the rock basalt, which makes up the floors of the ocean basins. Both types of crust lie on the Earth’s mantle, which is mostly the rock peridotite. The illustration below shows that the continental crust and the oceanic crust have different thicknesses. Continental crust averages about 22 miles thick (more underneath mountains), while oceanic crust averages about 5 miles thick. The two types of crust, and the underlying mantle, also differ in their density. Most Earth rocks range in density from about 2.6 to about 3.3 gm/cm3 -- even small differences in density can have important effects.
Density of the continental crust (put in your value for granite
from the first lab): ________ gm/cm3
Density of the oceanic crust (basalt): 3.0 gm/cm3
Density of the upper
mantle (peridotite): 3.3 gm/cm3
The geologist Clarence Dutton proposed decades ago that the Earth’s two types of crust “float” buoyantly on the mantle, much in the way that an iceberg or a block of wood floats buoyantly in water. He called this condition isostasy (Greek for “equal standing”). When the crust floats in a balanced, stable manner in the mantle beneath, we have a condition called isostatic equilibrium. This turns out to be a very useful concept, as you will see.
Question 5: What is the connection between wood floating in water and the crust (either type) floating in the mantle? Use specific values of density for wood, water, crust and mantle in your answer.
Question 6: Imagine a thick block of wood and a thin block of wood, both with a density of 0.5 gm/cm3 floating in water next to each other. Would the tops be at the same level? Why or why not?
Draw accurately a
side-view sketch showing how these two blocks would look floating next to each
other. Note:
“accurately” here means that you need to consider the density of the wood
relative to water.
_________________________________________________________________________
water
line
Question 7: Geologists know that the continental crust is much thicker underneath mountain ranges than it is in low areas. Thinking about your answers above, explain why.
Question 8: Thinking about all of your answers above, explain why the continental crust stands above sea level while the oceanic crust lies more than two miles (on average) below sea level. Your explanation should take into account both thickness differences and density differences.
ISOSTATIC ADJUSTMENT
When the Earth’s crust floats in a balanced, stable manner in the mantle, we have a condition called isostatic equilibrium. When this stability is changed by the addition or subtraction of weight, the crust adjusts by sinking down or rising up—a process called isostatic adjustment. Over human scales of time, this process is very slow; but over geologic time it can add up to a lot of change.
Question 9: An iceberg is floating in the ocean. A bunch of penguins jumps onto the iceberg. How does the iceberg adjust? The penguins jump off. How does the iceberg adjust?
Question 10: During the Pleistocene geologic period,
ice sheets formed repeatedly over parts of
Question 11: That big ice sheet has now mostly melted away. How do you suppose the North American continent has adjusted?
Question 12: That process of adjustment referred to in #9
above is still going on. Looking at a map of
Question 13:
Question 14: The Hawaiian Islands are volcanoes that
have built upward from lava eruptions on the
Part II. The Moving
Tectonic Plates and their Dynamic Boundaries
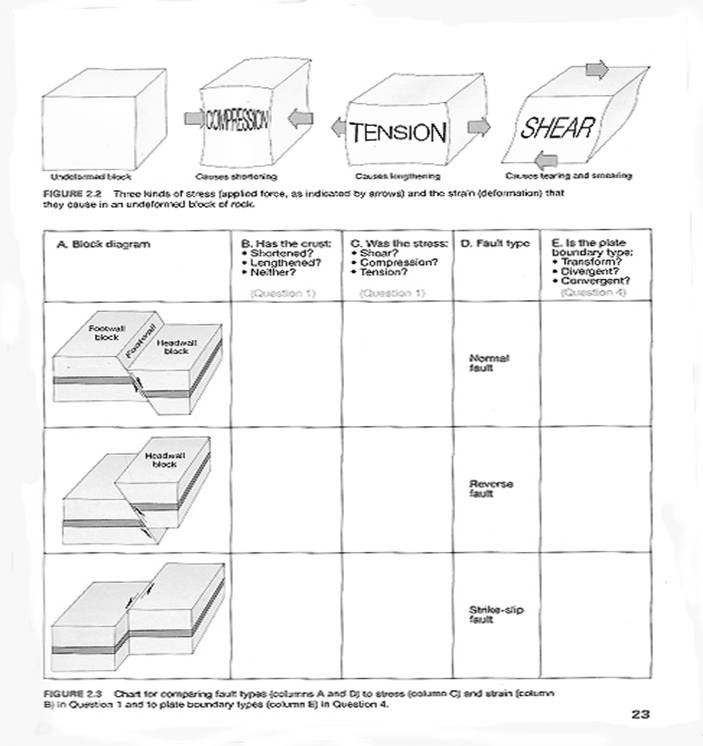
This part of the lab studies the nature and dynamics of Earth’s tectonic plates, and associated faulting and earthquake. In this part of the lab you will: 1) Become familiar with the global postions of the major tectonic plates; 2) Evaluate the types of stress and associated faults of each of the three types of plate boundaries; and 3) measure and evaluate plate motions.
Directions: Illustrate the major plate tectonic boundaries (see page 36; World map provided)
1) Draw in the three different plate boundaries found worldwide according to boundary type.
2) Draw and label each of three boundary types with a different color (red,
blue, and black)
3)
Label (by name) each of the
major tectonic plates – 14 plates total
4)
Draw motion arrows to show
the relative motion of the Pacific and North American Plates
Characteristics
of Plate Boundaries
Directions: Complete Columns “B”, “C” and “E” shown on page 34 using the answer sheet below
Column A: Block illustrations of three types of crustal faulting (type named in column D)
Column B: General type of crustal deformation associated with type of faulting.
Column C: The names of the major types of faults (see column “A”).
Column D: The names of the major types of faults (already provided) (see column “A”).
Column E: The type of plate boundary associated with “A”, “B”, “C”, and “D”).
Measuring and Evaluating
Plate Motions
Earth’s lithospheric plates slowly move
laterally over the asthenosphere – driven by a combination of heat, gravity,
and differences in rock density. Geologists
use several methods to establish plate velocities, which includes both speed
and direction. One method is to analyze
hot spot traces. Another method analyzes the age-dated magnetic
strips patterns imbedded in the seafloor’s basalt. Yet another method looks at the offset along
transform faults. In all three cases,
the two pieces of data that need to be collected to calculated plate motion are
distance and time – to get plate motion rate you divide distance by time as
centimeters per year.
Directions: Complete the following exercises. (See page 42 in you lab manual for directions for each specific plate motion exercise)
15. The
a)
b)
c)
d)
e)
f) Draw a large arrow and rate-of-motion value on
your personally constructed Plate Tectonic
Map near
16.
a)
b)
c) Draw a large arrow and rate-of-motion value on your personally
constructed Plate
Tectonic Map near
17.
The Juan de
a)
b)
c)
d)
e)
f) Draw
two large arrows and rate-of-motion values on your personally constructed Plate
Tectonic Map on opposite sides of the Juan de Fuca Ridge to show the
direction and speed of
both the Pacific and Juan de Fuca Plates.
18.
a)
b)
c)
d)
e)
Draw two large arrows and
rate-of-motion values on your personally constructed Plate
Tectonic Map on opposite sides of the
both the Pacific and North American Plates.
Part III. - Post Lab Exercise: Laboratory Reflection
Directions: Write a reflection (minimum 120 words in length) about your experience in doing the plate tectonic exercises lab today. Include the following: 1) What was the purpose of the lab?; 2) What did you learned from this laboratory?; 3) What did you find interesting? 4) What were the problems and challenges you encountered; and 5) Your opinion on how this lab was designed (the good or bad).